The 257 Variables I Use To Analyse Horse Races (Complete Guide)
This article explains the complete 257-variable framework I use to analyse horse races before placing a bet. It covers how I assess official ratings, Racing Post Ratings, pace shape, draw bias, trainer intent, handicap positioning, and market value to identify profitable opportunities in UK racing. Rather than relying on instinct or tips, this structured system breaks down every race into measurable components.
Most people look at a race and see a racecard, a bit of form, and a price. When I look at a race, I’m running a full decision engine — a framework built on 257 core variables that shapes every tip I put up, every Race Report I publish, and every bet I place with my own money.
To put that into perspective: the legendary Bill Benter changed the betting world by using around 120–130 variables in his Hong Kong model. That alone was enough to shock professional punters because nobody had ever applied data science to racing on that scale before.
What you’re about to see goes well beyond that. This 257-variable framework is the backbone of the analysis engine I’ve built over months of development — the same engine that turns full race data, sectionals, pace maps, professional ratings, draw trends, trainer cycles, and live Exchange behaviour into clear, value-focused each-way opportunities that everyday punters can actually use. Alongside the 257 variables, the system follows more than 100 internal rules that make sure every Race Report mirrors my own punting logic exactly.
This isn’t theory or guesswork. It’s the blueprint behind the winners we land and the value we uncover — from solid 8/1 shots right through to the 25/1 chances the market overlooks.
Before we dive in, it’s worth saying that you don’t need to calculate all 257 variables yourself. Some are straightforward, like spotting a class drop or checking a horse’s record at the track. Others — things like sectional efficiency, speed decay, stride patterns, or market-expectation ratios — are handled automatically within the engine when a Race Report is generated.
And while Benter famously used the Kelly Criterion to size his bets, I take a far more conservative approach. I prefer a steadier, safer version of “Kelly” for punters — one that protects your bankroll while still taking advantage of the value these variables expose.
Think of this article as your behind-the-scenes access. It shows you the depth of thinking that goes into each selection long before it reaches your screen — a blend of racecraft, data, and real-world punting logic that sits at the heart of everything I do.
Before we move on to the full list, it helps to understand how these 257 variables are organised — because not all of them carry the same weight.
Understanding the Tiers Not every question I ask carries the same importance. To make this easier to understand and to highlight the most important factors for you, each question is marked with a tier. These are:
• [T1] Primary – Core factors that most directly decide a horse’s chance of winning. • [T2] Secondary – Supportive or situational variables that refine judgement. • [T3] Tertiary – Fine-tuning details or edge cases that matter once the main picture is clear.
In practice, Tier 1 questions shape 70-80 percent of decisions; Tiers 2 and 3 add the context and polish that turn good analysis into great analysis.
If You’re New, Start Here (The 30-Minute Framework)
If 257 variables feels overwhelming, don’t panic.
You don’t need all of them.
If you’re new, focus on just these 12 core checks — and here’s exactly where to find the information for each one.
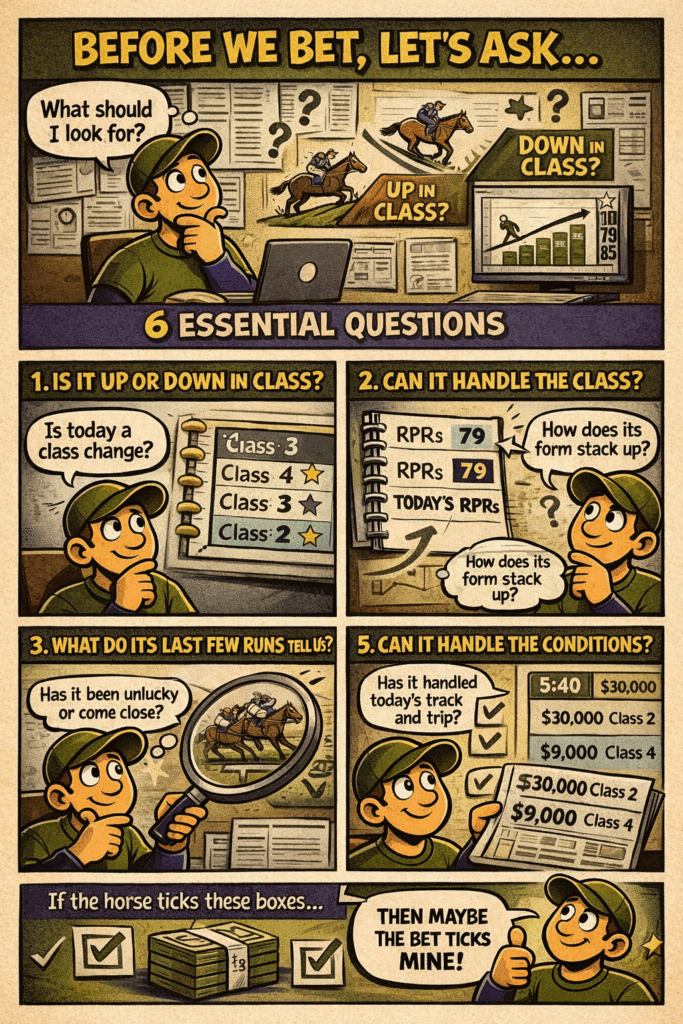
1. Is the horse dropping in class?
Where to find it: Look at the race class today (e.g. Class 3) and compare it to the class of its last 3 runs in the Racing Post profile.
What you’re looking for: A horse running in Class 3 today that was competing in Class 2 last time.
That’s a positive.
2. How does its last RPR compare to today’s field?
Where to find it: Racing Post Rating (RPR) column in the Racing Post full form line.
What you’re looking for: If your horse’s last RPR is 88 and most of today’s rivals run to 82–84, and they’re running off similar weights, it’s competitive on raw ability.
3. Does today’s trip suit?
Where to find it: Past race distances run in each horse’s Racing Post profile.
What you’re looking for: Wins or strong finishes at similar trips.
Avoid guessing on stamina if there’s no evidence.
4. Does today’s ground suit?
Where to find it: Going column in past runs + today’s official going at the top of the racecard.
What you’re looking for: Form on “Good to Soft” if that’s today’s description.
If all its best runs were on Firm, that’s a warning.
5. What does the pace map suggest?
Where to find it: Timeform pace map (behind a paywall) or manually check recent run styles.
What you’re looking for: If there’s only one habitual front-runner, that horse might control the race.
If there are four, the pace could collapse late as they take each other on.
6. Does the horse’s run style match the likely pace?
Where to find it: Watch one or two replays or read Timeform comments.
What you’re looking for: A strong finisher in a likely fast-run race. A prominent racer in a race lacking early speed.
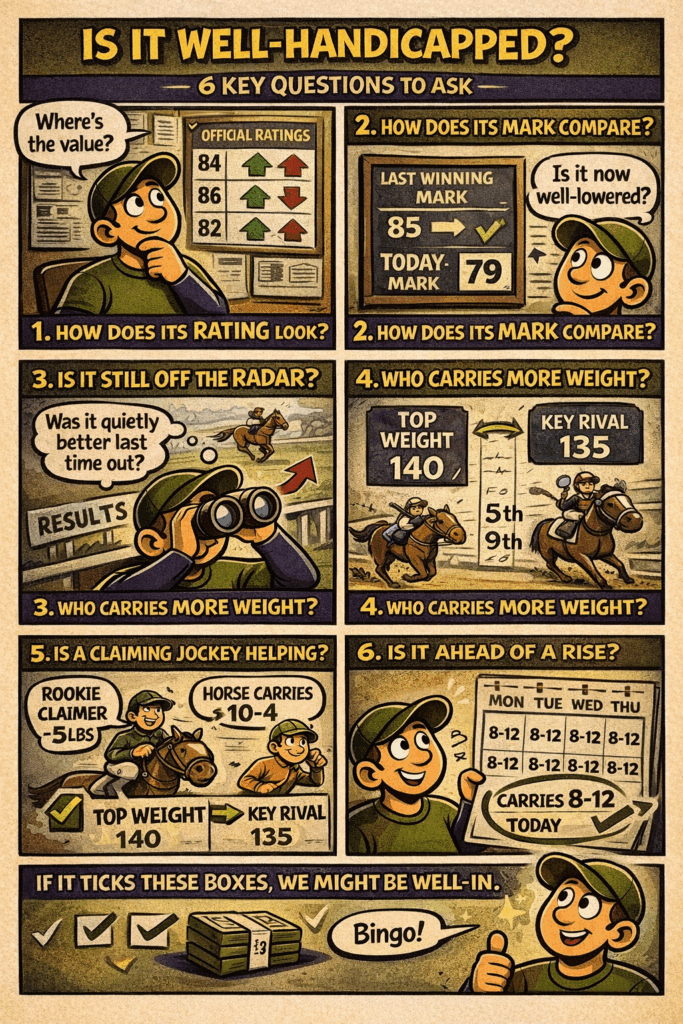
7. Is it well treated compared to its last winning mark?
Where to find it: Official Rating today vs Official Rating when it last won. You’ll find these respectively in the racecard and horse profile.
What you’re looking for: If it won off 90 and runs today off 84, that’s potentially well handicapped.
8. Did it finish strongly last time?
Where to find it: Replay or finishing comments.
What you’re looking for: “Stayed on strongly” is better than “one pace” or “weakened.”
9. Is the trainer in form?
Where to find it: Trainer 14-day strike rate on Racing Post or similar.
What you’re looking for: A yard running at 20% is generally sharper than one at 2%.
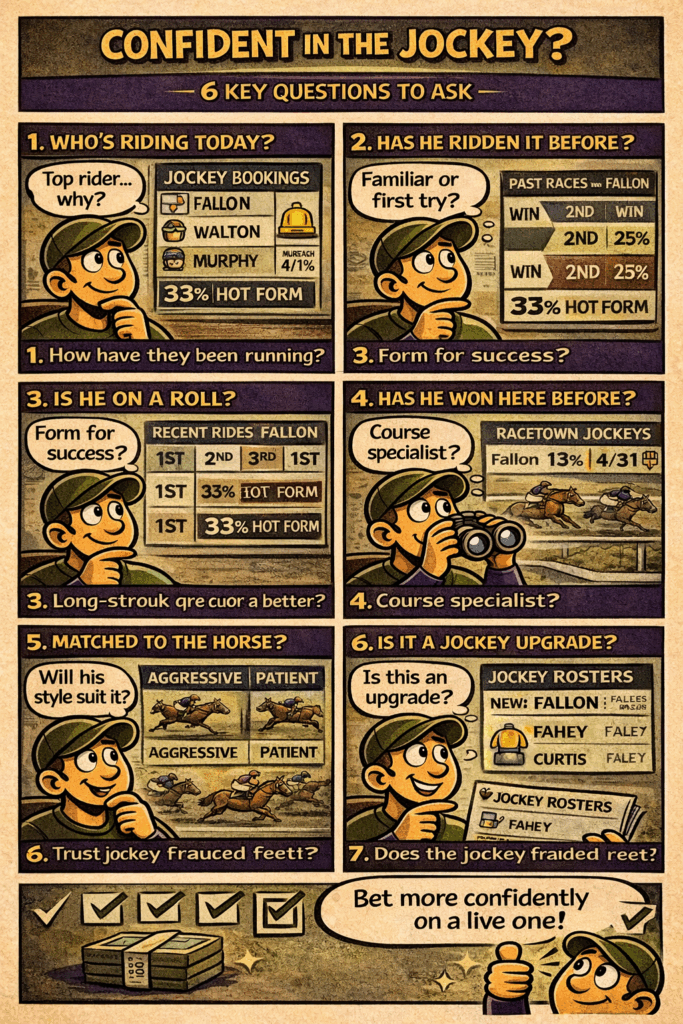
10. Is the jockey a positive booking?
Where to find it: Check if it’s a stable jockey, upgrade, or experienced rider.
What you’re looking for: A top rider replacing a 7lb claimer usually signals intent.
11. Is there a draw bias (Flat only)?
Where to find it: Track stats or recent race results at same trip.
What you’re looking for: If low draws dominate over 5f at Chester, a stall 14 draw is a red flag.
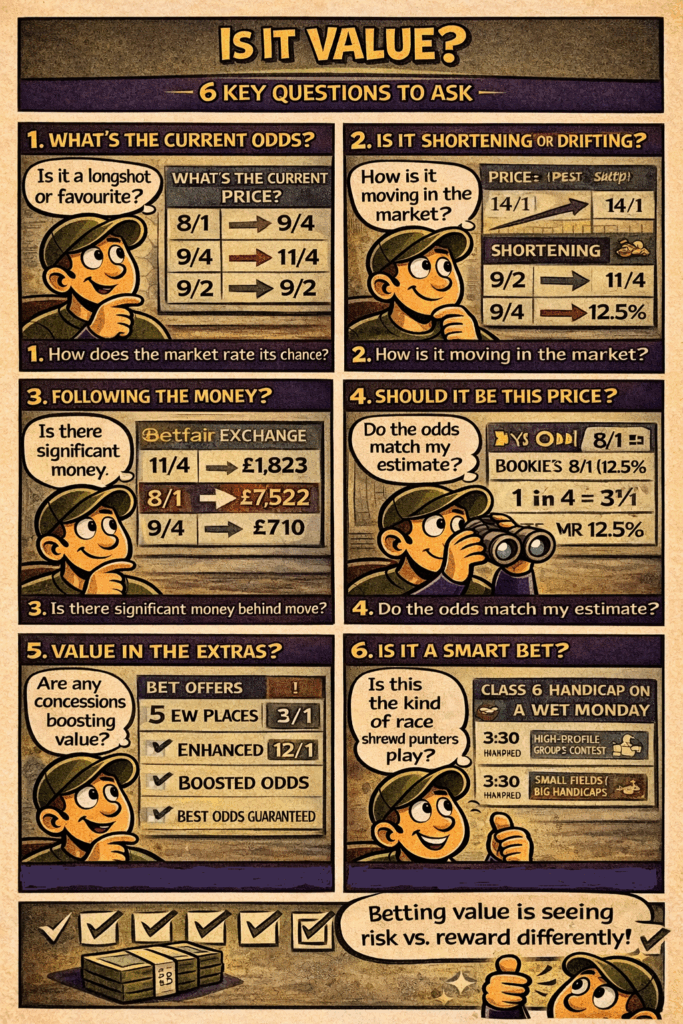
12. Is the price bigger than the chance?
Where to find it: Your own assessment.
What you’re looking for: If you think it has a 20% chance of winning (1 in 5 or 4/1) and it’s 8/1, that’s value.
If it’s 3/1, it’s probably not.
Why This Matters
If you master just those 12 checks, you are already ahead of 80% of casual punters.
The rest of the 257 variables refine the edge.
But these are the foundations.
Let’s start at the top: Form and Class — the foundation of everything.
FORM & CLASS (33 Questions)
1. [T1] Is the horse down in class today? Facing weaker opposition usually increases a horse’s chance of winning. Dropping from a higher grade can make a horse look more competitive — especially if it wasn’t disgraced last time.
2. [T1] Is the horse stepping up in class? Moving up in grade means tougher competition. Sometimes, though, an improving horse can handle it particularly if it won easily last time or has strong sectionals suggesting it may have more to give.
3. [T1] What class level has the horse already won at? Knowing the highest class the horse has won helps gauge its ceiling. A Class 2 winner running in a Class 4 race might be miles ahead of its rivals if still in form.
4. [T1] Has the horse been competitive at today’s class before? If it’s been placed or gone close at the same grade, it’s probably running at its ideal level. Horses that repeatedly finish mid-division at a certain class are usually a bit shy of that standard.
5. [T1] How strong was the form of its last race? Always check what the horses around it have done since. If several winners have come out of that race, the form is solid — and your horse might be better than it first appeared.
6. [T2] What’s the average Racing Post Rating of the top three finishers in its recent races? This helps measure the depth of competition. A race where the top three all ran to 90+ RPRs is far stronger than one where the winner scraped 76. It tells us whether the horse has been running in genuinely tough contests or flattering company.
7. [T1] How does its last Racing Post Rating (RPR) compare to today’s rivals? If the horse’s recent RPRs are higher than most of the field’s, it’s likely to be competitive. It’s an excellent quick way to benchmark ability.
8. [T2] Did it record a personal-best figure recently? When a horse hits a career-best RPR or Topspeed, it might be improving. But if that figure came from a hard race, it could “bounce” — so context matters.
9. [T1] Was its last run better than the finishing position suggests? Plenty of horses run well in defeat — they might have been blocked, given too much to do, or finished strongly too late. These are gold for value punters.
10. [T2] How long has it been since the horse last ran well? If a horse hasn’t shown any form in six or seven starts, you need a good reason to think today will be different (change of trip, class, surface, etc.).
11. [T2] Has it shown consistent form recently or been up and down? Consistency often reflects soundness and confidence. Inconsistent types can win at a price, but usually only when something changes in their favour.
12. [T1] Did the horse win or place in a race that has since worked out well?
This checks for hot form — races where several runners come out and win next time. It’s a good sign the form is strong.
But strong form doesn’t automatically mean value. It only becomes value if the market hasn’t fully reacted to it yet. If a horse ran better than it looked in a strong race and the price hasn’t shortened, that’s where the opportunity is.
13. [T2] Has the horse run in or placed in any “key form races” that keep producing winners? Some races act as long-term producer races — the same race throws up future winners year after year because the fields are usually strong. This is different from short-term “hot form.” Here you’re looking for races that have a proven history of producing good horses, not just this season’s results.
Spotting a horse coming out of one of these reliable “key races,” especially before the market reacts, is a classic value angle.
14. [T2] How did the horse finish the race — strong, weakening, or empty?
A horse’s action in the final furlong tells you a lot about its fitness, physical toughness, and how it handles the pressure of being challenged by other horses late on. You don’t need expert eyes — just look for simple signs:
Strong finish: head steady, stride still opening up, and the horse gallops through the line with purpose.
Weakened: head lifts, stride shortens, and the horse starts “paddling” — a choppy, unbalanced, tired-looking action that shows it’s running on empty.
Emptied out: no response to the jockey, legs everywhere, momentum gone.
Horses who finish smoothly and powerfully often have more to give next time, while those fading late may need a shorter trip, easier ground, or added fitness.
15. [T2] Has the horse ever been unlucky in running? Traffic problems or slow starts can disguise true ability. Spotting these types of issues from replays gives you an edge over punters relying on bare form lines.
16. [T1] Is the horse exposed or still improving? An exposed horse has run many times in similar conditions and tends to produce the same level of form; an unexposed one might still be on the up. The trick is spotting whether its ratings have been rising, flattening out, or tailing off over time. I use my AI assistant to map that long-term trend from the full Racing Post profile for the horse, but you can still judge it by eye — look for whether the horse’s best figures are getting better, staying the same, or slipping backwards.
17. [T1] Has it run well under similar conditions before? Horses often have preferred trips, classes and surfaces. Good form “in today’s conditions” is one of the strongest guides you can use.
18. [T1] Did it run to its mark last time out? If a horse rated 85 runs an RPR of 84–86, it’s performing about right. Anything significantly above or below tells you if it’s well or poorly treated.
19. [T1] How has the handicapper reacted to its recent runs? If it’s dropped in the weights despite running fairly, that’s positive. If it’s been raised after finishing only third or fourth, the handicapper might have overreacted.
20. [T2] Is there hidden form in maidens or novices that suggests more ability? Sometimes a horse finishes midfield in a hot maiden behind future Group performers. Those runs are often worth far more than they look on paper.
21. [T2] Has it recently run a race that puts it ahead of these rivals at the weights? This checks whether the horse has previously run to a higher Racing Post Rating than its rivals when you adjust for today’s race weights. If a past performance would already beat this field under similar conditions, that’s proven ability you can trust. For years, I’ve worked this out using mental arithmetic based on the info supplied by the full Racing Post profiles for each horse, but it’s a tough calculation to do manually — you’ll likely need some form of tool or system to use this metric yourself. It’s a great way to spot horses who are already “ahead” of the field on past form.
22. [T2] Has the horse shown a clear class ceiling or class floor? Class ceilings/floors are real edges — horses that repeatedly fail above a certain level, or thrive below one. This helps punters avoid “trap runs” (horses placed in races too hard) and spot well-treated drops in class.
23. [T1] Is its best form on a similar track type? Once you know a horse is up to the class, the next question is whether the track suits it. Some horses show their true form only on certain track types (undulating, galloping, turning), so matching that up with today’s venue is crucial.
24. [T2] Did the horse’s last run suggest it’s running into form? Many punters write off a horse after a few poor runs — but small signs of revival (travelling better, finishing closer) can signal a coming win.
25. [T2] Has the horse had excuses for poor recent runs? Wrong ground, bad draw, unsuitable pace, or wind issues — these can all explain dips in form. The key is to know when an excuse genuinely matters.
26. [T2] What’s the horse’s record when dropped out of pattern or listed company back into handicaps? When a horse returns to handicap level after running in stronger company, it often finds things easier. This question highlights those stepping back into calmer waters where their class edge reappears.
27. [T2] Has it ever beaten any of today’s rivals before? Head-to-head form can be telling, particularly if the weight difference is similar. A horse that consistently finishes ahead of another is likely to do so again.
28. [T2] How far has it been beaten in recent runs? Beaten a short head in a big field is often better form than finishing fourth, beaten 5 lengths, in a weaker race. Distances matter.
29. [T2] Has the horse been running in stronger or weaker regions/tracks? A Class 4 run at York often represents much tougher opposition than a Class 4 at Brighton. Geography and race strength aren’t always equal, and understanding which tracks attract stronger horses will set you apart.
30. [T2] How much prize money has the horse earned in the past 12 months? Prize money is an underrated class guide. Horses regularly earning decent purses tend to be consistent, reliable, and proven against stronger opposition. Some analysts even build full ratings around this idea — sites like InFineForm.com rate every UK runner each day purely on the prize money they’ve won in the last year. It’s a simple but effective way to spot horses used to competing at a higher level.
31. [T2] Has the horse been running in races worth significantly more prize money than today’s? The prize money on offer doesn’t always match the official class of the race. A horse dropping from £30,000 events into a £10,000 affair is almost certainly facing weaker rivals — even if both are Class 3 races on paper.
32. [T3] What’s the average prize money per run across its career? This long-term metric shows the overall level the horse has been competing at. Horses with strong average earnings per start are usually genuine, reliable performers who hold their own in better company. I use my AI assistant to calculate this automatically from the full Racing Post profile, and you’ll need to do something similar if you want to use this metric yourself — it’s quite tricky to work out manually.
33. [T2] How many pounds “well in” or “out of the handicap” is the horse today? If a horse carries less than its official mark due to a future rise not yet taking effect, it’s “well in.” Conversely, racing out of the handicap means giving away theoretical ground before the start.
OFFICIAL RATINGS, HANDICAPS & WEIGHT (Questions 34–57)
This section is all about value relative to ability. The handicapper’s job is to level the playing field — our job is to spot when they’ve got it wrong. On the Flat, extra weight mainly blunts acceleration and turn of foot; over Jumps it grinds away at rhythm, jumping efficiency and stamina over longer trips, so the same 3lb rise can have very different effects depending on the code. Understanding how ratings, weight, and marks interact is vital to knowing whether a horse is “well in,” “held,” or primed to strike.
34. [T1] What is the horse’s current Official Rating (OR)? The OR is the handicapper’s view of a horse’s ability. It’s the foundation for assessing whether the horse is fairly treated in today’s race compared to its past performances.
35. [T1] Has its rating gone up or down since its last run? A rise means the handicapper rated the run better than the bare result; a drop usually means it underperformed. Both can create opportunities — a well-handicapped horse after a quiet spell is often where value lies.
36. [T2] Has the horse’s official rating plateaued for several runs? When a horse’s rating stops rising or falling for several starts, it often means one of two things: either it has found its true level, or it’s being deliberately campaigned under similar conditions until the right setup appears. It’s an excellent way to spot “well-handicapped but waiting” types.
37. [T2] Is the horse running from the same mark as its last race? Running from the same mark means the handicapper hasn’t changed its view. If the horse shaped better than its finishing position, that could mean it’s effectively better than its rating today.
38. [T1] Has the horse ever won off today’s mark before? If it’s already proven capable from this rating, that’s a major positive. If it’s now rated much higher than its last winning mark, it may need to improve to win again.
39. [T1] How much higher or lower is the mark compared to its last win? This question helps identify “well-in” horses. A horse now 4–6lb below its last winning mark is often ready to strike when the right conditions return.
40. [T2] Has the handicapper been lenient after a good run? Sometimes a horse finishes close up in a strong race but only gets nudged up a pound or two. That leniency can mean it’s ahead of the system and worth backing.
41. [T2] Has the horse been raised harshly for a win or placed effort? On the other hand, a big rise (6lb+) for a narrow win can be over the top — especially if it came in a weak race. Understanding when a rise is excessive helps avoid false favourites.
42. [T1] Is the horse carrying more weight than ideal? Extra weight doesn’t just slow a horse down — it can affect balance, stamina and rhythm. Horses burdened near the top of the handicap often need class to defy it.
43. [T1] Has the horse won or run well carrying similar weight before? A proven ability to carry big weights is a sign of class and physical strength. Lighter horses often struggle when asked to shoulder more than usual.
44. [T2] Is the horse getting weight from key rivals? Receiving weight from similar or stronger horses is a genuine advantage. When the ability gap is small, weight concessions can easily swing the outcome.
45. [T2] Is the horse running under a penalty? Winners turning out quickly under a penalty are interesting — they can exploit the gap before the handicapper reassesses them. But if the penalty pushes them beyond their true ability, it’s a negative.
46. [T2] Is the jockey claiming any weight? A 3lb or 5lb claimer effectively reduces the weight carried, which can make a big difference. But not all claims are equal: a strong, experienced 5lb claimer can be a huge edge that the market underestimates, while a weak apprentice may ride well below their “allowance.” Evaluating the rider — not just the number — is key.
47. [T1] Is the horse well-in on future ratings (e.g. due to go up in future races)? If the handicapper has already announced a future rise but it runs before it takes effect, that means it’s technically “ahead of the handicapper.” That’s a punter’s dream scenario.
48. [T2] What is the top weight and bottom weight in the race? Knowing the weight range helps put each horse’s task in context. Horses near the top of the handicap might be the best in the race — or they could be unfairly burdened.
49. [T3] Does the horse’s physical build suit carrying weight? Big, powerful horses often handle weight better than smaller, lighter-framed types. Visual impressions and previous performances under load tell the story.
50. [T2] Has the horse ever run well off higher marks than today’s? If it has, it means the handicapper has now given it a chance again. Horses running off reduced marks after decent efforts in stronger races are always worth a second look.
51. [T2] Did the horse’s last run suggest the handicapper may have overreacted? If a horse was flattered by a soft lead or race bias, its rating rise might not be justified. Spotting those overvalued performances helps you find weak favourites.
52. [T1] How does the horse’s RPR compare to its OR today? If recent RPRs are higher than the current OR, it’s likely well treated. If they’re consistently lower, the horse is probably in the handicapper’s grip.
53. [T2] Is the horse’s Topspeed figure aligned with its rating? Topspeed often highlights whether a rating is based on genuine merit or tactical circumstance. A high OR with poor speed figures might not hold up under pressure.
54. [T2] What is the Horse’s Career High Adjusted Topspeed Figure? Topspeed figures adjust for track, distance, and going. A high career best number, even if old, indicates high potential ability that could be rediscovered.
55. [T1] Has the horse been competitive at similar weights and marks in the past? Historical performance at similar ratings often repeats. If it’s shown competitiveness before around this mark, it’s likely to do so again when other conditions fit.
56. [T2] What is the horse’s highest RPR achieved in the past 12 months? A horse returning to its recent peak RPR level (even in defeat) often signals readiness to win again.
57. [T3] How does the trainer’s record with horses dropping 3lb+ in the handicap compare to average? Some yards exploit drops masterfully; others don’t. It’s a clever trainer-pattern metric that fits naturally here.noise and uncertainty. Even when you’ve done your homework, it’s harder to feel confident you’ve covered every angle.
This group tells us whether the horse can actually deliver its ability in today’s circumstances. Matching stamina, speed and surface is where many punters go wrong — get these right and half the battle is won.
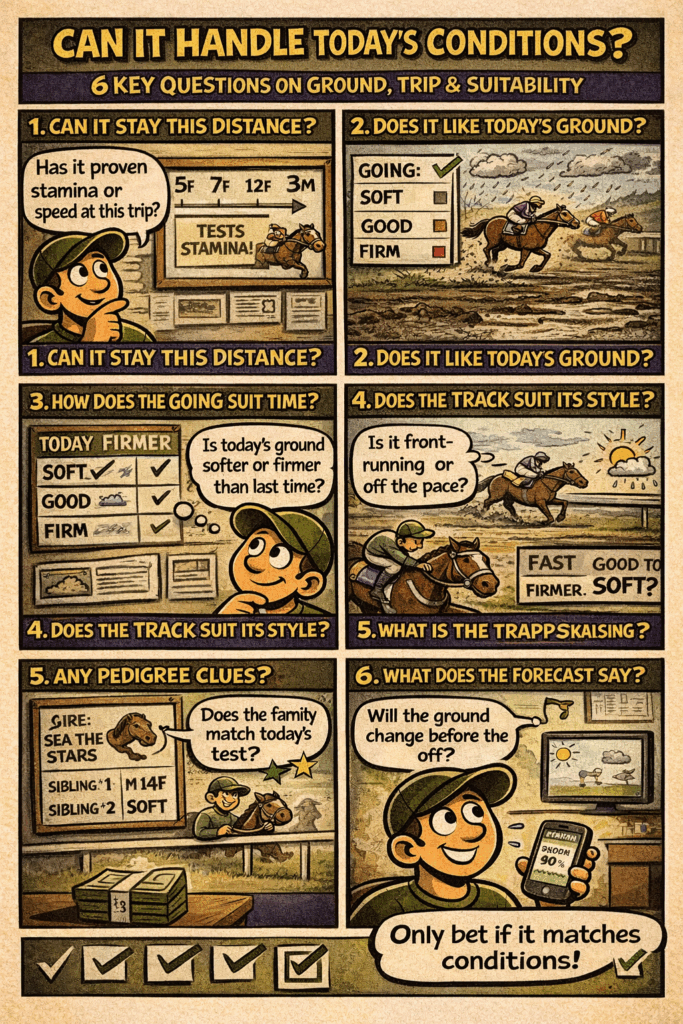
58. [T1] What trip is the horse running over today? Distance defines the test: pure speed at 5 furlongs, stamina at 2 miles. Always confirm that the trip matches what the horse has proved at or looks bred for.
59. [T1] Has the horse won or been placed at today’s trip? Previous success at the same distance is the clearest evidence of suitability. If it’s never shown form near this trip, you need another strong reason to fancy it.
60. [T2] Is the horse stepping up in trip? Extra distance demands more stamina and sometimes a different run style. Step-ups suit strong finishers or horses shaping as though they want further.
61. [T2] Is the horse dropping back in trip? Cutting back in distance favours natural speed and can help a horse that didn’t get home last time. But too sharp a drop can leave it outpaced early.
62. [T2] Has the horse’s running style suited its trip in the past? Front-runners usually prefer shorter trips where they can control the race; hold-up types need enough distance to wind up. Matching style to trip maximises efficiency.
63. [T1] What is the going (ground) today? Ground changes everything — firm, good, soft or heavy each demand different action and stamina. Knowing a horse’s ground preference is one of the biggest profit factors.
64. [T1] Has the horse won or run well on today’s going before? If a horse has form on similar ground, that’s reliable evidence. Guessing on unproven ground introduces uncertainty you don’t want in a bet.
65. [T1] Has the going changed since its last run? A swing from soft to firm or vice versa can transform chances. Horses that flopped last time may rebound on a sounder or softer surface.
66. [T2] What is the weather forecast and will the ground change before race time? Late rain or drying sunshine can flip the bias. Savvy punters watch forecasts and adjust when the conditions shift towards or away from a horse’s ideal.
67. [T2] Does the horse’s action suggest a ground preference? High, round action usually suits soft; daisy-cutters glide on firm. Visual clues often explain past form patterns.
68. [T2] Has the horse produced its best form on turf or all-weather? Some thrive on artificial surfaces, others can’t pick their feet up. Track surface alone can turn an average horse into a winner or vice versa.
69. [T2] If switching surface, has it run on this type before? First-time surface changes are risky unless breeding or action hints at suitability. Proven form is gold; guesswork is costly.
70. [T1] What does its pedigree say about ideal ground and distance? Sire stats reveal plenty — progeny of Sea The Stars often want 10 furlongs+, whereas Kodiac’s progeny typically suit sprints. Breeding fills gaps when race evidence is limited.
71. [T2] Has the horse shown stamina late in its races? Strong finishers at shorter trips usually relish further. Watching how it hits the line tells you more than the bare distance record.
72. [T2] Has it weakened close home in previous runs? Repeated fading late on suggests stamina limits. Unless the race pace collapsed, those horses often need shorter trips.
73. [T2] Has the horse ever run too freely over longer trips? Keen horses waste energy; dropping in distance can help them settle and finish. Recognising this pattern can spot winners at good odds.
74. [T2] Are there track-specific quirks affecting stamina (e.g., uphill finishes)? A stiff finish like Carlisle or Sandown magnifies stamina demands; a downhill run like Epsom lessens them. Adjust your view of “distance” accordingly.
75. [T2] Have the horse’s sectionals shown it can sustain its pace for the full trip? RaceIQ data revealing consistent fractions through the final furlongs confirm true stamina. Horses slowing sharply are vulnerable if upped in trip.
76. [T2] Is today’s trip/ground combination one it’s ever faced successfully? Sometimes a horse handles 7f on soft or 6f on firm but not the reverse. The blend of both factors is what really matters.
77. [T3] Does the trainer’s record show success when changing trip or ground? Certain trainers excel when experimenting — others rarely get it right. Knowing those patterns helps judge intent and confidence.
78. [T2] Has the course watering policy or drainage type affected going accuracy recently? Tracks like Newmarket or Goodwood can ride faster/slower than advertised due to watering or chalk-based soil. Punters who track this can find subtle edges.
79. [T3] How quickly does the ground typically dry at this track after rain? At some tracks (like Ascot or Sandown), “soft” can turn “good” by mid-afternoon. Strong wind, warm temperatures and low humidity act like a giant hairdryer, pulling moisture out of the turf far faster than the official description updates. A track called “Soft” at 8am can be riding much closer to “Good” by race time, especially on exposed straights. Knowing this drying profile — and when wind speeds up that process — helps you judge whether so-called mud-lovers are actually getting their ground, or whether sound-surface horses are quietly being favoured.
Breeding isn’t just about blue bloodlines — it’s about patterns that repeat. Sires and dams pass on traits for ground, distance, temperament, and even track preferences. Knowing how a horse’s relatives have performed helps predict whether today’s setup suits it down to the ground.
80. [T2] Who is the horse’s sire, and what traits does he typically pass on? Every sire has a signature — speed, stamina, or versatility. Knowing what the stallion produces helps you anticipate whether today’s test fits the horse’s genetic profile.
81. [T2] What’s the sire’s strike rate at this course or track type? If the sire’s progeny win frequently here (e.g. 49% strike rate at Lingfield), that’s a powerful signal the conditions suit his offspring’s running style and physique.
82. [T2] What’s the sire’s record on today’s going? Some stallions throw soft-ground sloggers; others produce firm-ground specialists. This can override even the horse’s own limited sample of runs.
83. [T2] What’s the sire’s record at today’s distance range? Pedigree distance patterns are remarkably consistent — you can often predict whether a horse will stay 1m4f just by checking its sire’s stamina index.
84. [T2] How do the dam’s progeny perform at similar trips or ground? The dam line contributes mental toughness and preference for certain surfaces. Consistent performers from the same dam line often share similar strengths.
85. [T2] Has the horse’s full or half-siblings won at similar conditions? Siblings offer a smaller sample but often stronger clues, especially for unexposed types or maidens.
86. [T3] Is the horse bred to improve with age or trip? Some sires produce late-maturing stayers; others throw precocious two-year-olds. Pedigree tells you whether improvement is likely with time or distance.
87. [T3] Does the pedigree suggest turf, AW, or dual-surface ability? Knowing whether a horse’s family excels on synthetics, turf, or both helps anticipate performance when switching codes.
88. [T3] Is there a stamina or speed bias in the immediate pedigree cross? Certain crosses combine stamina sires with speed dams (or vice versa). Understanding that balance reveals the horse’s likely optimum conditions.
89. [T3] Does the trainer have a strong record with this sire’s progeny? Some trainers just “get” particular bloodlines — they know how to campaign them for peak results. When you see a stable consistently doing well with a sire’s offspring, take note.
90. [T3] Has the horse’s pedigree produced proven winners over today’s course configuration (undulating / turning / straight)? Some bloodlines handle gradients or cambers better — a little-known but real influence at tracks like Epsom, Brighton, and Carlisle.
91. [T3] Are there any notable in-breeding or cross-line traits linked to temperament or toughness? In-breeding to certain sires (e.g. Galileo, Danehill) can produce mental fortitude or quirks. It’s niche, but advanced readers will appreciate it.
COURSE & TRACK BIAS (Questions 92–109)
Some tracks favour early speed, some suit late runners, others depend heavily on draw position or the ability to handle undulations. Knowing which is which — and which horses are built for them — is one of the biggest “hidden gem” edges in racing.
92. [T1] Has the horse ever run well at this track before? Course form is one of the strongest indicators of suitability. Horses that have already handled the bends, gradients, or surface idiosyncrasies are far more likely to run their race again.
93. [T2] Has it run poorly here before — and was there an excuse? Some horses simply hate certain tracks, while others were undone by draw, pace, or ground that day. Always look for context before assuming a genuine dislike.
94. [T1] Is the track galloping, sharp, or undulating — and does that suit the horse’s style? Big, lengthy striders thrive on galloping courses like Newbury, while agile, nippy types excel on sharp circuits like Chester or Catterick. Matching physical build and stride type to the course is key.
95. [T2] Does the track have an uphill or downhill finish? A stiff finish (like Sandown or Carlisle) demands stamina; downhill stretches (like Epsom or Goodwood) reward speed and balance. Horses with proven staying power cope better with an uphill climb.
96. [T2] How tight are the bends and how does the horse handle corners? Horses that hang or lose balance on bends often struggle around sharp turns. You can usually see this from previous runs at similar venues.
97. [T2] Has the horse’s best form come on straight or turning tracks? Some horses prefer an uninterrupted straight gallop (Newmarket, Ascot), while others are better turning left or right. It’s often a matter of rhythm and mental comfort.
98. [T2] Which direction does the horse tend to hang under pressure? If it hangs right and the track turns left, that’s a recipe for trouble. Horses that lean the “wrong way” on bends lose ground at vital moments.
99. [T1] Is there a known draw bias at this track and trip? At some venues, draw position can decide races — low draws dominate sprints at Chester, while high numbers can be golden at Ascot when the ground’s quick. Knowing current biases helps avoid bad bets. Over Jumps, draw barely matters; on the Flat, especially round tight bends or on certain all-weather tracks, it can be the difference between a great trip and an impossible one.
100. [T2] Has the horse been helped or hindered by the draw in past runs? A horse repeatedly trapped wide or forced to challenge on the wrong part of the track might have more ability than its form suggests. Recognising that builds value.
101. [T1] What draw has it been given today, and is that positive or negative? The draw sets up the race tactically before the gates open. Favourable stalls near the rail or away from crowding can be worth several lengths.
102. [T1] Is there a pace bias at this course today? Some tracks reward front-runners (like Lingfield AW), others favour strong finishers (like Newcastle AW). Track configuration, weather, and rail movement can all shift these biases.
103. [T2] Has the horse shown the ability to race effectively from that draw position before? If it needs to lead but is drawn wide at Chester, that’s trouble. Conversely, a hold-up horse drawn wide on a straight track might have no issue at all.
104. [T2] What’s the historical strike rate for front-runners versus hold-up horses at this course and trip? Studying pace trends shows you what run styles statistically succeed. It’s invaluable context when judging whether your horse will get the run of the race.
105. [T3] Does today’s rail position alter the effective distance or bias? At many tracks, moving the running rail changes how races play out — for instance, at York or Ascot, a moved rail can make one side slower or quicker. It’s subtle but powerful intel.
106. [T3] How does the prevailing wind direction and strength affect the run-in here? A strong headwind into the straight blunts front-runners and makes it much harder to sustain early fractions; a strong tailwind has the opposite effect, boosting finishing speed and helping hold-up horses who can be delivered late. Just as important is whether the wind is steady or gusty. Sudden gusts act like surprise shoves — they can unbalance horses, make them lug in or out, and unsettle highly-strung types far more than a constant breeze. In the AI Race Reports, this is handled through a simple headwind/tailwind intensity view, but in practice you’re just asking: does today’s wind help front-runners, finishers, or mentally tough, straightforward horses?
107. [T3] Is the track being used after a heavy rain/cold snap (fresh turf/new ground)? Horses can sometimes struggle on very fresh, unused ground that is unevenly prepared or soft from recent rain/frost protection.
108. [T3] Has the track undergone recent surface or layout changes that affect bias data? Sometimes the camber, turf composition, or synthetic surface is renewed — this can reset years of draw/pace patterns overnight. For example, Southwell’s switch from Fibresand to Tapeta completely changed its pace bias and draw dynamics, rendering historical trends unreliable until new data built up.
109. [T3] Has the horse ever run on a similar track profile (with comparable radius and finish)? A neat way to project suitability when there’s no direct course form — e.g. Catterick ≈ Chester, Newbury ≈ Doncaster.
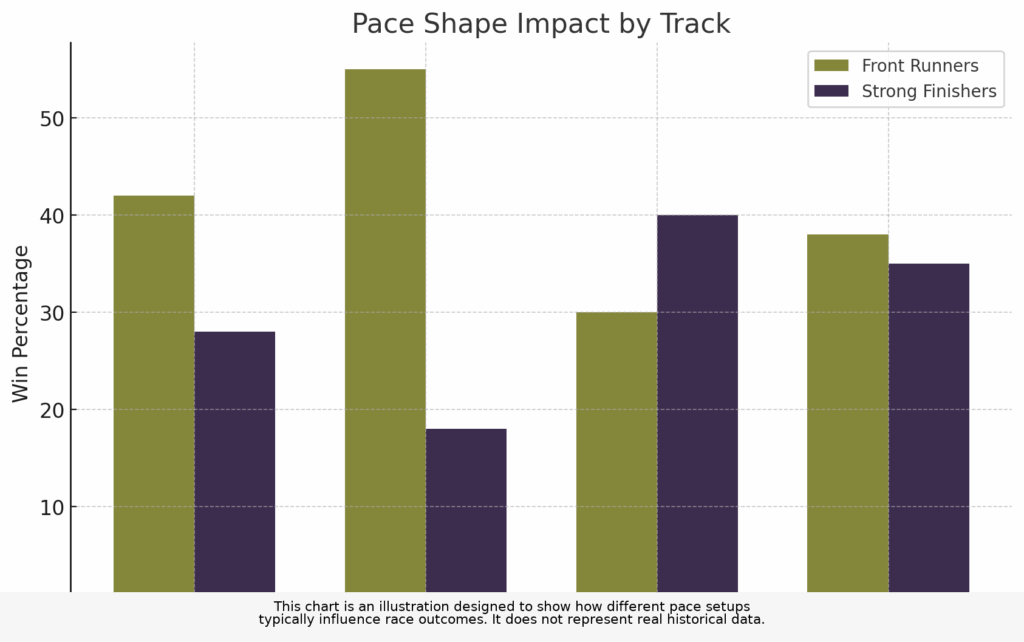
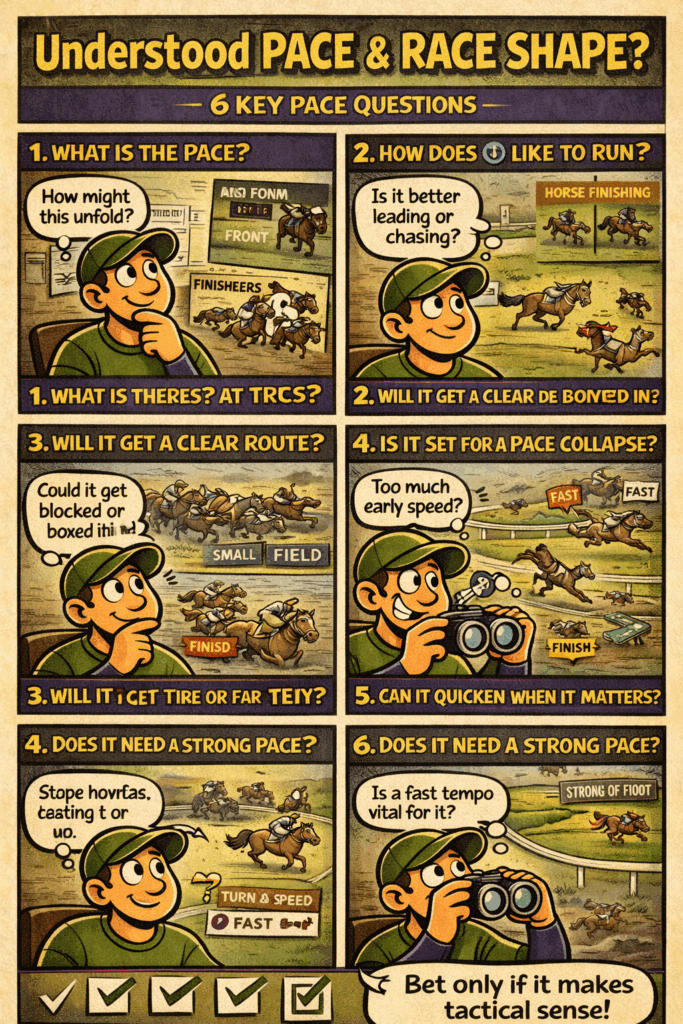
PACE, RUN STYLE & RACE SHAPE (Questions 110–131)
Pace determines rhythm, rhythm determines position, and position determines opportunity. A well-handicapped horse can’t win if it’s trapped behind traffic or used up early. This section is all about how the race is likely to be run, and whether your selection’s natural style fits the shape.
110. [T1] What is the likely pace setup in the race? Before anything else, you need to visualise how the race will unfold. Are there multiple front-runners, or could one horse get an easy lead? A simple pace map often predicts the race result before it happens.
111. [T1] How many confirmed front-runners are in the field? If there’s just one, that horse could dominate from the front. If there are four or five, they’ll likely cut each other’s throats, setting it up for strong finishers.
112. [T2] How many hold-up horses are there? If most prefer to be dropped in, the early tempo could be steady — which suits those racing prominently. Too many “waiters” can turn the race tactical.
113. [T1] Has the horse shown a consistent run style? Some horses always front-run, others stalk, some are lazy until the final furlong. Knowing this helps predict how they’ll be positioned today.
114. [T2] Is the horse adaptable in how it races? The best handicapped horses often fail when asked to race differently. Versatile types can handle both strong and slow paces — invaluable in unpredictable setups.
115. [T1] Has the horse won from its likely run style before? If it’s a habitual front-runner, look for previous front-running wins. If it’s a finisher, check for past success in similar tactical setups.
116. [T1] Does the track layout favour its run style? Some courses, like Chester or Lingfield (AW), reward front-runners due to short straights. Others, like Newcastle or Ascot, give finishers a fairer crack. Always marry pace to course.
117. [T1] Is there a potential pace collapse in the race? A “pace collapse” happens when too many go forward too hard, too soon. Finishers can pick them off late — these are golden each-way opportunities. On the Flat, collapses usually come when too many go too hard, too soon; over Jumps they more often happen when the ground is testing, the trip is long, or inexperienced riders force the pace in the middle part of the race.
118. [T2] Has the horse benefited from or suffered in pace collapses before? Patterns repeat. If it’s won from off a hot pace before, it may do so again. If it always fades when there’s no early speed, that’s a tactical weakness.
119. [T1] Has the horse shown the ability to settle? Keen or headstrong horses waste energy early and often fade late. A relaxed traveller, by contrast, conserves fuel for the finish — especially in strongly-run races.
120. [T2] Does the horse have a good “cruising speed”? Horses with a high natural cruising speed can sit handy without working too hard. That trait wins plenty of races, especially when the pace is even.
121. [T2] Does the horse respond quickly when asked for effort? Turn of foot is crucial. Some need time to hit top gear; others can accelerate instantly. Understanding that timing helps predict whether it can make use of gaps when they appear.
122. [T1] How efficient were the horse’s sectionals in recent races? RaceIQ data shows how evenly the horse spread its energy. Overexerting early or leaving too much late usually leads to defeat. The most efficient horses are often the most reliable.
123. [T2] Has the horse shown consistent finishing speed percentages (FSPs)? Stable FSPs suggest a horse runs true to type; wide variations hint at poor tactics or changing conditions. Spotting steady improvers through FSPs is an edge.
124. [T1] Is the jockey known for good pace judgement? A cool-headed rider who understands pace — like Ryan Moore or Tom Marquand — can make all the difference. Poorly-judged fractions from the saddle are costly.
125. [T1] Has the jockey previously ridden the horse to its ideal run style? Some jockeys just “click” with certain horses because they understand its rhythm. Prior evidence of successful tactics is a major plus.
126. [T2] Are there likely to be traffic problems given the field size and the horse’s run style? Hold-up horses in big fields are often boxed in; front-runners risk pressure from multiple rivals. Anticipating that avoids unlucky bets.
127. [T2] Has the horse been caught wide in recent runs? Being trapped wide wastes ground and energy — effectively running an extra few lengths. If today’s draw reduces that risk, expect improvement.
128. [T1] Is the race likely to suit prominent racers, midfield runners, or finishers? Based on the pace map, predict which run styles will enjoy the best race flow. If your horse fits the “favourable flow,” confidence rises.
129. [T1] Does the projected pace align with the horse’s ideal scenario? This is the ultimate question. If you know how the race will be run, and your horse’s style suits it, everything else — class, weight, form — falls into place.
130. [T2] Has the horse ever been the sole pace angle in a race and made all? True lone leaders win more often than markets predict — identifying when a horse is likely to get an uncontested lead is one of the biggest hidden edges in handicaps.
131. [T3] Have recent sectional or stride-length figures shown a late-race slowdown trend? If data shows the horse’s stride shortens or final-furlong speed dips across runs, it might have gone off the boil or lost finishing efficiency — a subtle but valuable insight when weighing pace stamina.
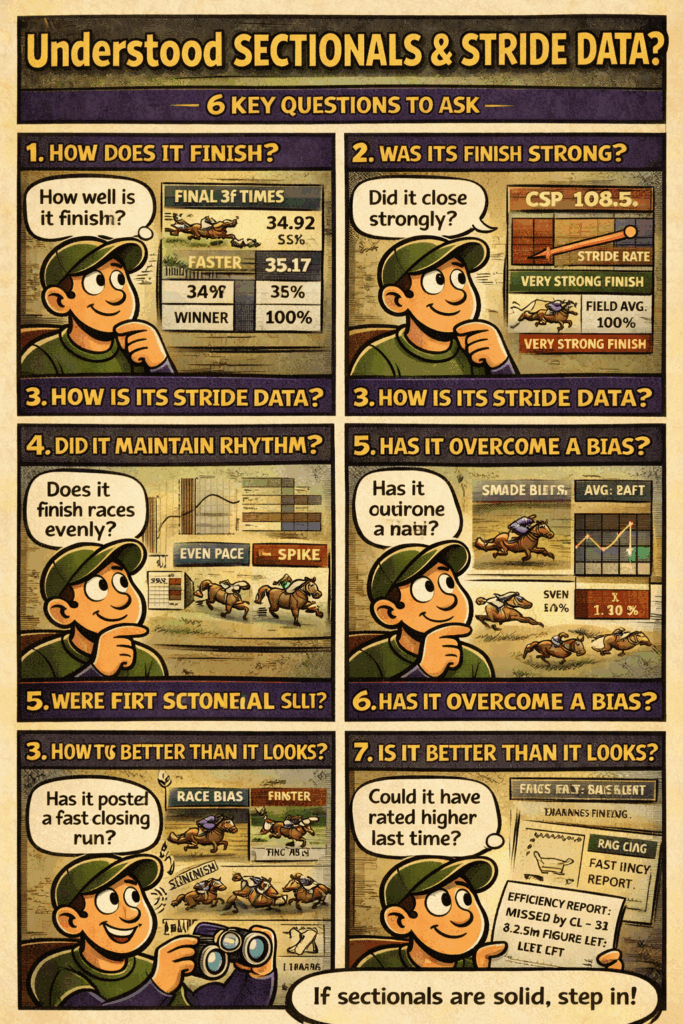
SECTIONALS, STRIDE DATA & FINISHING SPEED (Questions 132–151)
This is where the stopwatch and stride tracker replace guesswork. Sectional times and stride data reveal how efficiently a horse runs, whether it’s been ridden to suit its natural rhythm, and if it’s capable of more than the bare result shows.
132. [T1] What were the horse’s finishing sectionals last time out? Late splits (final 2f or 3f) show how much running the horse had left. Fast finishing sectionals in defeat are often the clearest sign of a horse ready to win next time.
133. [T1] Did the horse record a higher closing speed percentage (CSP) than the field average? A CSP above 100% means it was finishing faster than the race pace — a key sign of strength and untapped potential, especially in slowly-run races.
134. [T1] How do its sectionals compare to those of the winner or placed horses? Beating the winner on closing fractions despite finishing behind can reveal unlucky losers or those who simply ran out of room. That’s pure gold for spotting next-time winners.
135. [T2] Were the early sectionals too strong or too slow for its style? If a hold-up horse was forced into a quick early pace, it might have emptied late; if a front-runner crawled early, it might have been outsprinted. Context explains “flat” performances.
136. [T2] Did the horse produce an even pace profile throughout the race? Horses that run steady fractions and maintain rhythm tend to be genuine, consistent types. Big mid-race spikes usually indicate tactical errors or stamina limits.
137. [T2] Has the horse ever posted sectionals suggesting it can rate higher than its RPR? RaceIQ data often highlights horses capable of better than their official figures show. When sectionals indicate 2–3lb extra in hand, you’ve found hidden value.
138. [T2] Did the horse’s finishing effort come against a race bias? If it clocked a fast finish in a race that heavily favoured leaders, that performance is better than it looks. Sectionals put visual impressions into numbers.
139. [T2] Does the horse have a “negative sectional split” record? A negative split (running the final part of the race faster than the first) is a sign of an efficiently ridden horse with stamina remaining. A strong record here is a huge plus.
140. [T1] How does the horse’s optimal speed profile compare to today’s race shape? Some horses need a sustained gallop; others need a slow pace followed by a sharp burst. This connects their intrinsic data to the projected pace setup.
141. [T2] How does its stride length compare to the field average? Long-striding horses usually need space and galloping tracks; shorter strides suit tight turns. Knowing this helps match horse to course.
142. [T2] Has its stride frequency changed between runs? A higher stride frequency can mean freshness or headstrong running; a slower one may signal fatigue or discomfort. Tracking those changes can flag when a horse is at peak fitness.
143. [T2] Does it maintain stride length under pressure? Good horses sustain their stride even in the final furlong. When stride shortens dramatically, it often points to stamina limits or physical niggles.
144. [T2] Has the horse produced “top three” sectionals in any of its recent races? Being among the fastest closers in a race — even when finishing fifth or sixth — highlights potential improvers who didn’t get the run of things.
145. [T3] Has the horse produced its best sectionals on a particular track type? Sectional strengths are often surface-dependent — some sustain speed better on synthetic tracks, others on turf. Patterns here can reveal when conditions are ideal.
146. [T3] Has the horse improved its finishing speed over the last few runs? An upward trend in finishing times indicates rising fitness or confidence. Downward trends can mean regression or being campaigned under wrong conditions.
147. [T3] Are the sectionals consistent with its official rating? If sectionals show the horse is consistently finishing faster than similarly-rated rivals, its current OR may underestimate its true ability. That’s a “value marker.”
148. [T3] Has the horse ever run to figures suggesting a 4lb+ improvement potential? Identifying horses likely to improve by 4lb or more based on sectionals, finishing bursts, or stride data gives you an analytical edge. Those are the ones that beat their marks and land each-way bets.
149. [T1] Has the horse produced any outlier runs on the clock (RPR, Topspeed, or sectionals) above its usual level? Occasionally a horse will post one huge figure that stands out from the rest of its form. When that effort came under ideal conditions, it proves latent ability — the kind that reappears when circumstances align again.
150. [T3] Are sectional or stride data samples reliable for this track/trip?
Not every course provides perfect timing or GPS coverage — and small-sample sectionals can mislead. For example, data from a lightly raced regional track or a new synthetic surface might not yet be consistent. Always check how dependable the data is before treating it as gospel; unreliable figures can make a horse look faster or slower than it truly is.
151. [T3] Did RaceIQ or GPS data flag inefficiency or irregular stride last time?
Sometimes technology spots what the eye can’t — like a horse shortening stride mid-race or taking longer to reach top speed than usual. When RaceIQ or GPS data flags “inefficiency” (uneven stride rhythm or loss of fluency), it often hints at fatigue, minor discomfort, or simply being out of sync with the race pace. These are small red flags that can explain below-par runs and signal a horse that might bounce back when back in rhythm.
ADVANCED SECTIONAL ANALYTICS (Questions 152–166)
This extra block takes things a step further. Once you start compiling your own sectional data day-by-day, you’re no longer looking at one race in isolation — you’re spotting patterns, repeat behaviours, track strengths, and hidden upgrades that never show up in the bare form book. These questions help you pull that extra layer of value out of the data.
152. [T1] Did the horse run a finishing-speed % above the course-and-trip average?
Some tracks have naturally slower or faster finishes. If your horse beats the par figure for today’s course and trip, it’s running better than most realise — especially if the market hasn’t adjusted to it yet. Over Jumps, this matters even more: longer races punish early inefficiency, so jumpers with consistently above-par finishing-speed % figures are often much stronger stayers than their marks suggest.
153. [T1] Was its “Going Allowance” better than par for the day?
The sectional databases provide a going allowance for each run. If your horse copes better with the ground than the field average, that’s a big plus. Horses who run well against a slow/holding surface often shorten on better ground next time.
154. [T1] Where did it rank in the field for sectional efficiency?
A simple ratio: Speed Figure ÷ Distance Beat. If a horse finishes behind but still beats most of the field on this metric, it has more to offer than the result suggests.
155. [T1] Was its energy-use profile within a normal range?
Using Finishing Speed %, Going Allowance and distance, you can see whether the horse emptied early or ran efficiently. Staying within a tight band (±5%) usually means the horse ran to its level.
156. [T2] Is its Finishing-Speed % trending upwards over the last 2–3 runs?
An improving FS% often means fitness is building or the horse is settling better mid-race. Downward trends usually signal the opposite.
157. [T2] Has it beaten the median Speed Figure in two of its last three runs?
You don’t need it to be fastest — just consistently better than the middle of the field. Horses doing this regularly tend to be underrated by the market.
158. [T2] Does it show better sectionals when the trip increases or decreases?
Your database will show whether the horse is naturally happier at 6f, 7f, or 1m. Strong late work at 6f often screams “up in trip”.
159. [T2] Is there a link between layoff length and finishing efficiency?
Some need a run. Some go best fresh. If FS% spikes after 40+ days off, or collapses when turned out quickly, note it.
160. [T2] Does the horse prefer certain course types?
The sectional databases include detailed course descriptions showing whether a horse performs better on::
flat tracks,
stiff uphill finishes,
tight turning circuits, or
long straights. Horses often thrive on one shape far more than others.
161. [T3] Has it produced top-quartile finishing speeds at multiple tracks?
If the horse delivers strong finishes at more than one venue, it’s not a fluke — it’s a horse with genuine repeatable ability.
162. [T3] Is its FS% stable across recent runs?
Low variance = consistency. High variance = pace-dependent type. Consistent horses are gold for each-way betting.
163. [T3] Does the yard show a stable-wide sectional pattern?
Some trainers produce fast finishers. Others produce horses that empty off the bridle. Knowing the yard’s tendency helps you interpret single runs more accurately.
164. [T3] Has the horse ever produced an above-par sectional on a track where front-runners dominate?
This is one of the sharpest hidden gems: if a horse finishes fast against a leader-bias track, mark it up heavily.
165. [T3] Has the course shown a sectional bias shift in the last 60–90 days?
Tracks go through phases — some months favour front-runners, some favour finishers. With a database, you can detect these swings early and beat the market to them.
166. [T3] Have sectionals improved since a wind op or headgear change?
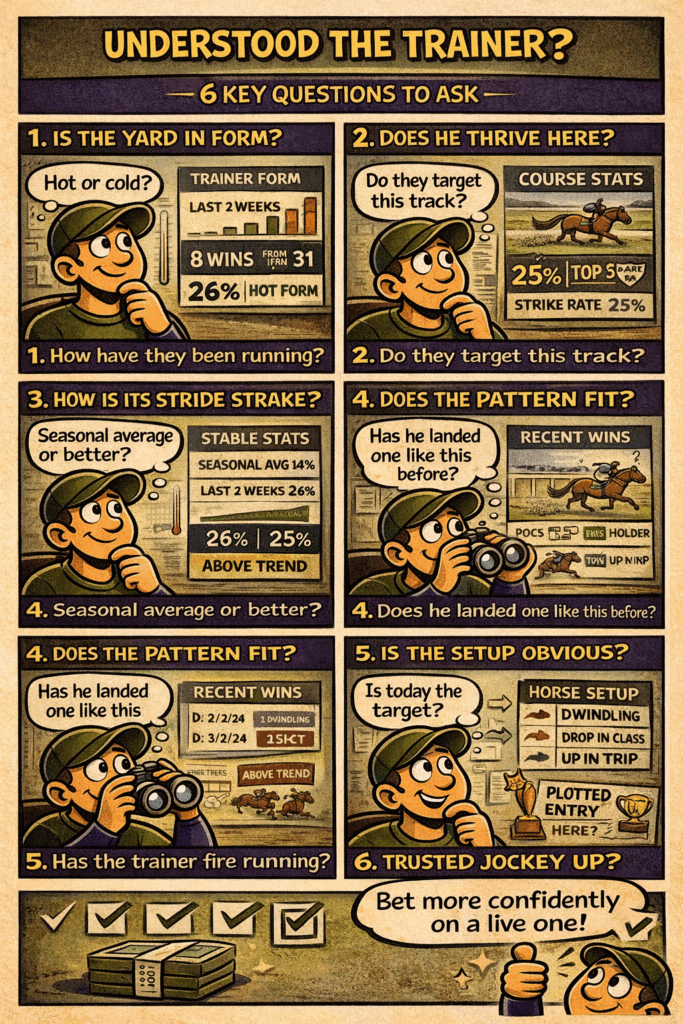
TRAINER FACTORS (Questions 167–187)
Every trainer operates differently. Some aim horses at one big day, others train them to win frequently. Some peak in certain months or at specific tracks. By decoding trainer behaviour, you’re effectively reading between the lines of their formbook.
Trainer Form, Habits & Patterns
167. [T1] What is the trainer’s recent form (last 14 days)? Good form breeds confidence — both in the yard and on the track. A trainer operating at a high strike rate means their horses are fit and well, which boosts trust in your selection.
168. [T1] What is the trainer’s long-term strike rate at this course? Some handlers just “get” certain tracks. Whether it’s the journey, surface, or local setup, strong course records often point to repeat success.
169. [T1] How does the stable’s current form compare to its seasonal average? A yard running above its yearly average is often “flying.” A dip below might mean something’s amiss — poor health, bad ground, or simply out of form.
170. [T2] Has the trainer had recent winners with similar profiles? If the yard has just scored with a horse dropping in class or up in trip, that pattern might repeat. Trainers often work to themes.
171. [T2] Does the trainer have multiple runners in the same race? When a stable runs two or more, one is often there to ensure pace or test conditions. Identifying which is the intended one is an art — follow the money and the jockey bookings.
172. [T2] Has the trainer been targeting this horse for a specific race? Some horses are campaigned months in advance for a single event. A well-timed drop in grade, favourable jockey booking, or notable entry pattern can give it away.
Fitness Cycles & Preparation
173. [T2] What is the trainer’s record with horses returning from a break? Certain trainers (like Charlie Appleby or William Haggas) excel first time out; others need a run or two to sharpen their horses. It’s crucial context for assessing fitness.
174. [T2] Has the horse been running frequently, and does the trainer thrive with quickturnarounds? Some stables, like David O’Meara’s, win plenty with horses reappearing within 7–10 days. Others rarely score without proper recovery time.
175. [T2] Has the horse run to form when racing within seven days of its previous run? Some yards excel with “quick returners.” Others see drop-offs when horses reappear too soon. Recognising those patterns helps identify intent and readiness.
176. [T2] What’s the trainer’s record with horses second or third run after a layoff? Many target the second or third start for peak performance. Spotting that pattern can flag when a horse is primed to strike.
Tactics, Change & Intent
177. [T2] Has the trainer made notable equipment or distance changes today? Blinkers, tongue-ties, and trip adjustments often signal intent. Yards don’t make changes for fun — they’re usually looking to unlock improvement.
178. [T2] Has the horse responded well to a trainer switch in the past? Some horses show sharp improvement when joining a new yard due to different training methods, a change of scenery, or better placement. If a horse has a history of bouncing back after a switch, today’s move could trigger another step forward.
179. [T2] Does the trainer have a good record in today’s race type (handicap, maiden, nursery, etc.)? Specialists exist in every sphere. For example, Sir Mark Prescott is renowned for handicap plots, while Richard Hannon excels in 2yo maidens.
180. [T2] Has the trainer previously won this specific race or one similar? Many trainers target the same fixtures year after year. Historical success at certain meetings (like York Ebor or Glorious Goodwood) is rarely coincidence.
181. [T2] What is the trainer’s record in races worth £X or more (i.e., chasing prize money)? Big-money races attract intent. When a mid-tier yard sends one to a high-value contest, it usually means they believe the horse is ready to deliver.
Broader Yard Patterns
182. [T3] Does the trainer’s yard tend to peak at this time of year? Some stables fire in spring, others come alive in the depths of winter. These seasonal cycles often tie in with how a yard trains, the type of horses they keep, or simply when they’ve historically hit form. I use my AI assistant to track these long-term patterns across the Racing Post records, but you can still get a feel for it yourself by checking whether the yard usually performs well around this time each season.
183. [T3] Does the trainer have a good record with today’s owner or ownership group? Some trainers reserve their best rides and plots for key owners — success often follows where strong partnerships exist.
184. [T3] Does the trainer have a trusted jockey partnership or preferred pilot for winning opportunities? When a stable’s “go-to” rider is on board, it’s rarely accidental. Stable jockeys and regular collaborators know how to execute the yard’s preferred tactics.
185. [T3] Does the trainer’s yard have a first-time-wind-op or gelding angle? Some yards consistently produce improved runs after operations or gelding. These physical changes can unlock a new level of performance.
186. [T3] Has the trainer shown a clear pattern of improving horses after joining the yard (new acquisitions)? Certain trainers, like David Evans or Mick Appleby, are known for getting immediate improvement from new recruits. Spotting that profile can highlight live outsiders.
187. [T3] Are there any signs of long-term planning or handicap manipulation? Carefully managed campaigns — dropping in trip, class, or weight over several runs — can set up a “plot job.” Recognising those fingerprints is one of the clearest ways to spot value before everyone else does.
JOCKEY FACTORS (Questions 188–202)
The jockey is the final piece of the puzzle. Their judgement, balance, and partnership with the horse turn potential into performance. The following questions help you weigh up whether the rider strengthens or weakens the bet.
Experience, Familiarity & Form
188. [T1] Who rides the horse today? Always start here. The name in the saddle tells you a lot about intention. A top jockey booking often signals confidence from the yard.
189. [T1] Has the jockey ridden the horse before? Familiarity breeds success. Riders who know the horse’s quirks — how it settles, when it idles — can time the run far better than a newcomer.
190. [T1] What’s the horse’s record with this jockey? Some partnerships click. A 2-from-3 record together is a powerful indicator that the combination works. Poor results can mean a style clash.
191. [T1] What’s the jockey’s current strike rate? Confidence matters. A jockey in form rides instinctively, makes bolder decisions, and times runs better. Cold spells can signal hesitation or bad luck.
192. [T2] How has the jockey performed at this course historically? Each track rides differently — knowing the cambers, wind direction, and ideal lines takes experience. Course specialists often outperform their averages.
193. [T1] What’s the trainer–jockey combination’s strike rate? Some pairs are far greater than the sum of their parts. When a yard calls up its “go-to” rider, it’s rarely without reason.
Style, Tactics & Suitability
194. [T1] Is the jockey suited to the horse’s run style? Aggressive front-runners (like Oisin Murphy) suit positive tactics, while patient riders (like Jamie Spencer) excel from the back. Matching personality to pace plan is vital.
195. [T2] Is the jockey known for being a strong finisher (a “hands and heels” rider) or a good front-runner? Some jockeys excel at getting horses to settle and finish; others are masters of rating a pace from the front. Matching the rider’s skill set to the horse’s strengths matters hugely.
196. [T2] Does the jockey have a good record in today’s race type or class level? Top riders often specialise — some shine in big-field handicaps, others in tactical Group races. Horses need pilots who thrive in that environment.
197. [T2] Has the jockey made tactical mistakes on this horse before? If they’ve previously gone too soon or left it too late, will they learn from it? Awareness of past errors helps judge whether improvement is likely.
198. [T2] Is the jockey an upgrade, downgrade, or like-for-like change? When a stable replaces a 5lb claimer with a top senior rider, it’s usually intent. Likewise, if a good jockey is replaced by an inexperienced one, ask why — it often hints at yard strategy.
Added Depth & Hidden Professional Angles
199. [T3] Does the jockey have a strong record when riding for this owner? Certain owners favour specific riders — and those partnerships often carry long-term trust. When that trusted rider is booked, it usually signals confidence and genuine intent.
200. [T3] Has the jockey travelled a significant distance for just one ride? When a jockey travels hundreds of miles for a single mount, it’s rarely by accident. These “one-ride trips” often flag well-fancied chances or stable confidence.
201. [T3] Has the jockey recently returned from injury or suspension? Riders coming back are often hungry and sharp, but sometimes rusty. Spotting whether they’re still regaining rhythm or immediately back to form helps refine confidence in the ride.
202. [T3] How does the jockey perform in big-pressure finishes or photo finishes? Some jockeys hold their nerve and time their effort to perfection under pressure, while others panic. The ability to judge the line and pace under stress can make or break tight handicaps.
DRAW, FIELD SIZE & RACE SETUP (Questions 203–217)
Draw and field dynamics affect every race differently. A good analyst treats them as part of the puzzle, not an afterthought. Knowing whether your horse is likely to find clear running room, get boxed in, or land on the right part of the track can make or break a bet.
Draw Position & Bias Clarity
203. [T1] What is the horse’s stall (draw) position today? The draw sets the horse’s starting point — crucial in sprints and at courses with strong biases. A high or low number isn’t automatically good or bad; what matters is how it fits the course layout.
204. [T1] Is there a known draw bias at this course and trip? Certain venues, like Chester (low) or Beverley (high), have long-standing patterns. Knowing these in advance prevents backing a good horse from an impossible position.
205. [T1] Has the draw bias changed recently due to weather or rail movement? Heavy rain or a shifted running rail can flip draw advantages overnight. A dead rail can suddenly become the “golden highway.” Staying alert to changes can uncover late value.
206. [T2] How has the horse performed from similar draw positions before? Some break fast and can overcome a wide berth, others need cover. Past performance from similar stalls helps you predict whether today’s gate suits or hinders.
Draw Interaction with Run Style & Field
207. [T2] Has the horse’s draw or race position correlated with finishing position recently? If every poor run came from wide draws or traffic trouble, its form might be better than it looks. Recognising that correlation often reveals hidden consistency.
208. [T2] Does the horse’s run style suit its draw? A front-runner drawn wide around a bend will likely waste energy; a hold-up horse drawn inside risks being boxed in. Matching draw to preferred tactics is vital.
209. [T2] How big is today’s field? Field size shapes race rhythm. Small fields tend to turn tactical; big ones create stronger early pace and more chance of traffic issues.
210. [T2] How has the horse performed in fields of similar size? Some relish the hustle of 16-runner handicaps; others lose focus or struggle to find gaps. Understanding temperament relative to crowding is a subtle but key edge.
211. [T2] Does the field contain multiple horses with the same run style? If half the field want to lead, expect a speed duel. If they all drop in, a bold front-runner could dominate. Identifying the tactical balance defines the likely race shape.
Conditions, Layout & Environmental Factors
212. [T2] Will the horse have cover or be exposed in running? Horses needing cover can pull hard if forced wide or in open air. Wind exposure — especially on long straight tracks — drains energy and affects finishing effort.
213. [T3] Are there debutants, returners, or unexposed horses likely to distort the setup? First-time runners, lightly raced types, or “plot horses” returning from breaks can unexpectedly inject pace or alter race rhythm. Professionals always consider these wildcards.
214. [T3] Has the course made recent layout or surface adjustments that affect bias data? Major surface changes or relaid tracks can reset years of draw patterns; old data becomes unreliable until new trends form.
215. [T2] How often does the rail position change here, and is today’s configuration unusual? Some tracks rotate their rail weekly, effectively creating a “new course.” A rarely used configuration can shift the effective draw or impact race tempo.
216. [T3] What is the weather impact on the stalls or start point? In strong crosswinds, outer stalls can break slower or face extra drag. Wet starts may also cause stalls near the rail to be stickier. Marginal gains matter in tight handicaps.
217. [T3] Have starting-gate procedures at this track caused issues before? Awkward loading sequences or uneven ground near the gates have spoiled many races. Horses that are nervous or fidgety can lose several lengths before the race has even begun. And that’s rarely Saturday afternoon on ITV.
MARKET & VALUE ANALYSIS (Questions 218–234)
Markets are just opinions with prices attached. Our job as each-way value punters is to find when the market’s opinion is wrong. These questions focus on whether the odds, timing, and market behaviour make the selection a value play rather than just a hopeful bet.
Understanding Price & Probability
218. [T1] What are the current odds for the horse? Start simple — what’s the actual price? It defines your potential return versus the risk. Without knowing this, you can’t possibly assess value.
219. [T1] How do those odds compare to your own assessment of its true chance? If you rate a horse a 20% chance (1 in 5) but it’s priced at 8/1 (12.5%), that’s value. If it’s 3/1 (25%), it isn’t. The gap between your view and the market’s is where profit lives.
220. [T1] Has the price shortened or drifted since markets opened? A shortening price suggests confidence; a drift can signal concern. Neither guarantees anything — but they show how informed punters are positioning.
221. [T1] What time did significant market moves occur? Early moves often come from smart money; late ones can be bookmaker reaction or public momentum. Timing adds crucial context to any move.
222. [T1] How much has been matched on Betfair Exchange? Liquidity matters. A move backed by thousands of pounds means something — a move caused by a few £20 bets usually doesn’t.
223. [T1] How do the odds compare across bookmakers? Discrepancies between firms flag potential mispricing. If Bet365 go 20/1 when others sit at 12/1, that’s your window of value — but it won’t stay open for long.
Reading Market Behaviour & Intent
224. [T1] Is the horse shortening while others in its price range drift? When one horse attracts steady money while rivals ease, it’s often a quiet confidence signal — “follow the money” still has its place, if you catch the value before it’s gone.
225. [T1] Is the move backed by meaningful exchange volume? Big prices mean nothing without real money behind them. Sustained liquidity is a stronger clue than sudden, shallow spikes.
226. [T2] Is there a clear reason for a drift (ground, draw, trainer comment)? Not every drift is bad. Some are overreactions — like a “bit of drizzle” making punters panic over a supposed going change. Distinguishing false drifts (noise) from true drifts (information) separates casual punters from professionals.
227. [T2] Has the horse’s price shown similar patterns before its past wins? Some horses are habitually backed late by connected money. If you’ve noticed the pattern before, don’t ignore it — lightning often strikes twice.
228. [T2] What is the Projected Betfair Starting Price (Projected BSP) compared to the current Exchange price? If the projected BSP is shorter, there’s likely more support coming. If it’s higher, the market’s cooling. Watching this live gap gives real-time clues about confidence and momentum.
Measuring Value in Context
229. [T2] How does the current price compare to the Racing Post forecast or early tissue? If the horse is much shorter than predicted, smart money’s landed. If it’s much bigger, either the market’s missed something — or the forecaster overrated it.
230. [T2] Are the place terms or each-way concessions favourable? Extra places, enhanced odds, or best-odds guarantees all affect value. Sometimes 12/1 with five places beats 16/1 with four.
231. [T2] How efficient is the market for this race type? Big handicaps tend to be tight and accurate; low-grade midweek races are looser. Real value hides where the market guesses, not where it’s sharp. Apprentice-only handicaps are a classic example: bookmakers often struggle to price the gap between the best and worst claimers, which means shrewd judges can regularly find mid-price value where a good apprentice is booked on a solid, straightforward horse.
232. [T2] Is this the kind of race where smart money usually plays? High-profile races attract informed money and tighter odds; Class 6 handicaps on a Monday night often don’t — which is exactly where value lurks for shrewd punters.
233. [T3] Does the price genuinely reflect all available information? If new data — ground changes, jockey switches, wind surgery — isn’t yet fully priced in, that’s your window. Value betting is about timing: being right before everyone else realises it.
234. [T2] What is the A/E (Actual vs Expected) value for the horse’s recent runs? This figure compares how often a horse actually wins versus how often the betting market expected it to win. It’s a way of measuring whether the horse — or its stable — tends to outperform or underperform its odds over time.So, we’re factoring in whether a horse, jockey, or trainer has historically beaten the market expectation. This is one of the many data-driven measures the AI evaluates automatically when comparing form, and it’s a great way to spot potential value bets.
If the A/E is above 1.00, it means the horse (or trainer/jockey) wins more often than the market predicts — they’re consistently underrated or offer good value. If it’s below 1.00, they win less often than expected, suggesting they’re often overbet or overpriced by punters.
Think of it like this:
“Does this horse or yard usually give punters a fair run for their money — or do they tend to go off shorter than they should?”
It’s one of the best ways to identify who beats the market and who doesn’t.
Every horse is an individual. Some need racing to get fit; others peak fresh. Some thrive with blinkers; others resent them. Watching how a horse is campaigned, equipped, and presented tells you more than most punters ever realise.
Fitness Cycles & Recovery Patterns
235. [T1] How long has it been since the horse last ran? Recency is vital. Too long off and it may lack sharpness; too soon and it may not have recovered. Finding each horse’s ideal recovery window is a key edge.
236. [T1] What’s the horse’s record when fresh (off a break)? Some horses burst back to life after a layoff; others need a run to blow away the cobwebs. Understanding which type you’re dealing with helps time your bets.
237. [T1] Has the horse had a notable break before its last run? Patterns repeat. Some horses are best first-up; others peak third-up. Tracking layoff patterns season-to-season reveals their natural fitness rhythm.
238. [T1] Has the horse improved second or third run after a break before? Plenty of horses hit top form only once race-fit. When that pattern repeats across seasons, you can often predict their next winning window.
239. [T2] Was the horse gelded since its last run? Gelding can dramatically improve focus and behaviour — particularly in colts who’ve shown greenness or lack of concentration. Many improve sharply once cut.
Physical Condition & Equipment Signals
240. [T2] How fit did the horse look in the paddock last time? Body condition speaks volumes — sweating, lack of muscle tone, or excess condition can all show it’s short of peak. Watching replays or paddock footage is invaluable.
241. [T2] Has the horse shown signs of discomfort or unsoundness? Hanging, shortening stride, or being eased late can hint at underlying issues. Fitness isn’t just stamina — it’s freedom of movement and willingness to race.
242. [T2] Has the horse undergone wind surgery, and how has it performed since? Wind ops can be game changers. Improvement after surgery shows the issue was real; no changesuggests it wasn’t the root cause.
243. [T2] Does the horse wear headgear today (blinkers, cheekpieces, visor, etc.)? Headgear can sharpen focus — especially first-time use. Repeated use without benefit often signals limited impact or a deeper mental issue.
244. [T2] Is the horse trying new equipment for the first time? First-time additions like a hood, tongue-tie, or visor nearly always signal intent. Trainers rarely make changes for no reason — it’s often a “today’s the day” clue.
245. [T2] How has the horse reacted to similar equipment before? If it’s previously improved in cheekpieces, that’s a plus. If it’s run worse wearing them, it may dislike restriction or altered sensory input.
Temperament & Behavioural Clues
246. [T3] Has the horse ever refused, reared, or played up at the start? Temperament matters. Nervy or reluctant loaders waste energy before the gates even open — it’s an often-overlooked form factor.
247. [T3] Does the horse tend to sweat, pull, or get agitated in prelims? Overexcitement drains energy. Some horses thrive “on their toes,” others need calm. Recognising which temperament you’re dealing with prevents costly misreads.
248. [T3] Has the horse shown signs of improved demeanour recently? A calmer parade, relaxed walk, or happier attitude can indicate growing confidence and fitness — a subtle but powerful pre-race positive.
Campaign Logic & Physical Maturity
249. [T2] Is the horse’s campaign pattern logical? Are they building fitness through sensible runs, or bouncing between unsuitable conditions? Structured campaigns often signal purpose and planning.
250. [T3] Has the horse been running under ideal weight-carrying conditions (age, sex, or allowances)? Younger horses maturing physically often handle weight better with experience. Older types may need help through drops in class or jockey claims.
251. [T2] Does the horse look or feel like it’s “ready to win”? This ties everything together — fitness, behaviour, and setup. When the horse looks well, drops to the right trip, and conditions align, that’s when professional punters strike.
EXTERNAL OR CONTEXTUAL FACTORS (Questions 252–257)
These questions focus on the “outside world” influences — owners, travel, timing, and motives. They rarely appear in data but can reveal why today matters.
252. [T2] Is the horse running at a meeting or track significant to the owners or trainer? Some owners target home tracks or big social meetings; certain trainers always aim to have winners at their local course. Those emotional or logistical reasons can drive intent far beyond the formbook.
253. [T2] Has the horse travelled a long distance to run here? Cross-country or cross-sea travel costs time and money. A long journey often signals confidence in conditions — connections wouldn’t send it unless they fancied a bold run.
254. [T2] Is the race part of a festival or televised card where the yard likes to perform? High-profile days attract motivation. Trainers love winners on ITV or at major meetings; they prepare horses more sharply for those opportunities.
255. [T3] Are there any ownership or syndicate storylines in play? First-time owners, syndicate milestones, or memorial races can create extra effort from the yard. Sentiment occasionally translates into intent.
256. [T2] Does this run fit a bigger target plan (e.g., prep run, future handicap mark, or pattern entry)? Sometimes today isn’t the day — it’s groundwork for something else. Recognising when a horse is being readied rather than primed stops you from betting at the wrong time.
257. [T2] Are there any upcoming entries or race plans that hint at intent? Future entries often reveal a trainer’s hand. If a horse has multiple upcoming entries at similar trips or one notable higher-grade engagement, today could be a prep — or a confidence booster before that main target. Conversely, if it has no future entries, this might be the target. Monitoring entries and withdrawals in the days before a race helps spot these clues long before the market reacts.
These outside-the-formbook clues are often what separate guesswork from genuine understanding — and they’re the final layer before everything comes together in the full framework.
HOW TO ACTUALLY USE THE 257 VARIABLES
If you’re reading this and thinking, “There’s no way I can apply 257 questions to every race,” relax.
You’re not supposed to.
This framework isn’t a checklist you mechanically tick off from start to finish. It’s a structured decision system. Professionals don’t start at question one and work down to question 257 — they filter first, then refine.
Here’s how the process actually works in real life:
Step 1 – Choose the Right Race
Before analysing any horse, filter the race itself. Is the favourite vulnerable? Are the each-way terms fair? Is the field size workable? If the race structure is poor, move on. The best bet is often no bet.
Step 2 – Check Conditions (Tier 1 Core)
Trip. Ground. Track profile. If the horse is wrong on any of these, stop. These are “critical failure” variables. A horse unsuited by conditions rarely becomes value just because the price looks big.
Step 3 – Assess Ability vs Mark
Class level. Official Rating versus past peak RPR. Weight relative to rivals. Is the horse well treated, fairly treated, or held by the handicapper? This is where most bets are won or lost.
Step 4 – Map the Pace
Visualise the race. Who leads? Who sits handy? Who finishes late? Does the projected pace suit your horse’s natural style? Even a well-handicapped runner can’t win if the race shape is completely wrong.
Step 5 – Add Refinement
Trainer patterns. Jockey suitability. Sectionals. Draw interaction. Wind and track bias. These don’t usually create a bet — they strengthen or weaken one.
Step 6 – Only Then Look at the Price
Now ask the final question: Is the market underestimating this horse’s chance?
If the price is bigger than your assessment of its true probability, you have value. If not, you pass.
The Minimum Viable Model
If you’re newer to structured analysis, start here:
• Conditions (trip & ground) • Class level • Rating versus mark • Pace suitability • Price versus probability
Master those five pillars and you’re already operating ahead of most recreational punters.
Everything else in the 257 variables is edge refinement — the polish that separates a solid bettor from a consistently profitable one.
The goal isn’t to use all 257 every time.
The goal is to think in the right order.
And once that order becomes habit, the process stops feeling complicated — it becomes instinct.
CLOSING THOUGHTS Behind every Race Report, behind every tip I share, and behind every bet I personally place, sits this same logical framework. Each question is designed to strip emotion from the process and replace it with structured reasoning. Of course, not all 257 questions will apply to every race — many are situational. But the power lies in the habit of asking them. Over time, that habit becomes instinct, and instinct is what separates disciplined punters from impulsive ones.
These reports connect three worlds that rarely meet: the art of race reading, the discipline of data modelling, and the precision of AI. The framework is human-led — I set the logic, ask the questions, and make the judgement calls — while the AI handles the heavy lifting on numbers such as sectionals, pace shape, market efficiency signals, and A/E-style metrics. The aim is transparency and consistency: traditional formcraft, structured through data, executed with modern tools.
Built from JJ’s 257-question framework; this is human-led analysis powered by data, not generic machine text.
AUTHOR’S NOTE This 257-question framework isn’t here to turn racing into a maths project. It’s simply a way of making sure every bet has been properly thought through from the very first step to the very last.
Long before we get into form, class, trip or pace, the foundations are already being built — checking the going, watching the weather, understanding how the track is likely to ride, and choosing the right race in the first place. That early filtering is where most punters go wrong. Picking races with weak favourites, solid each-way terms, sensible field sizes, and a clear angle is half the battle before you even start digging into the details.
Everything that follows — the form work, the pace maps, the sectionals, the class analysis, the ground preferences, the value judgement — is layered on top of that initial race selection. And when all of those layers line up, that’s when the bet becomes logical rather than hopeful.
Every winner, every near miss, and every no-bet day that keeps your bankroll safe comes from following the same process: choose the right race, understand the conditions, test the horse against the variables, and only then decide whether the price is worth playing.
The tier markers throughout this list aren’t rules — they’re simply a guide to the order professional punters work through things — first choosing the right race, then checking the conditions, then doing the form, then judging the pace, and only then looking at the price. Follow that order and your decisions become much easier and far more consistent.
Hi, I’m 56 and have been tipping profitably year after year since 2012. I created this "ethical" website to help punters like you make a little extra on your bets. My approach focuses on finding and highlighting each-way value, then guiding you to the bookmakers offering the best prices or paying extra places on the race.
While the site has no affiliations with any bookmakers (and I don’t receive money from them), regularly taking advantage of their offers can seriously boost your profits over time.
What you’ll find here are well-researched tips, backed by solid reasoning and clear logic behind every selection. If you’d like to learn more about me, just click on the "About" section on the Home Page.